2026-06-28 · Updated 2026-07-26
Website Speed Optimization: Core Web Vitals and Faster Loads
Practical website speed optimization: fix Core Web Vitals, compress images to WebP, minify code, cache smartly, and use a CDN with measured load-time wins.

Last updated: July 26, 2026
Website speed is the first thing users feel and one of the last things teams fix. In my own work, images are usually 60 to 80 percent of page weight, and shrinking them is the fastest, cheapest win. But a fast page needs more than compressed images: it needs stable layout, a responsive server, smart caching, and code that does not block the render path.
Quick answer: what actually makes a website fast?
Use WebP or AVIF images at the exact display size, lazy-load below-the-fold media, defer non-critical JavaScript, cache static assets for a long time at a CDN edge, and measure with both lab and field data — that combination is what makes a website fast. A fast page also loads its largest visible element quickly, responds to taps without delay, and never shifts around as it loads. Start with images, because they are the single biggest weight on most pages, then fix JavaScript, then caching and delivery.
What are Core Web Vitals and which ones still matter in 2026?
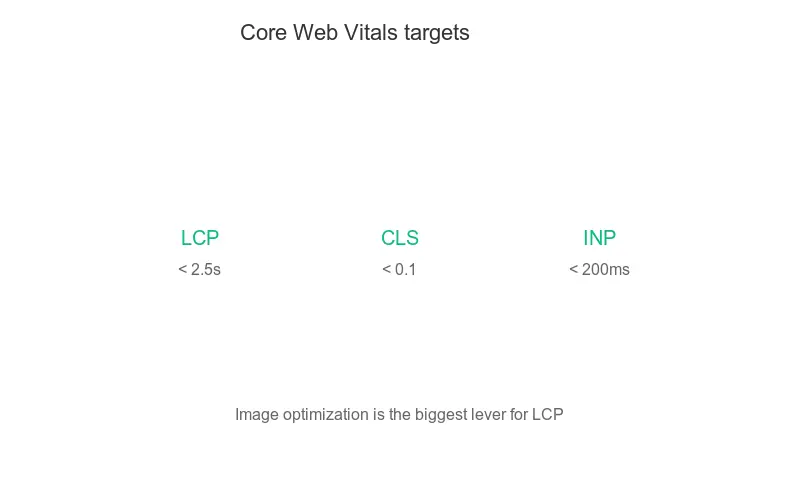
Core Web Vitals are Google's three field metrics for real user experience. Google documents the thresholds and methodology in its Core Web Vitals overview. The three to track:
- Largest Contentful Paint (LCP) — when the largest visible element renders. Good is under 2.5 seconds.
- Interaction to Next Paint (INP) — responsiveness to user input across the page lifecycle. Good is under 200 milliseconds. INP replaced First Input Delay in March 2024, so any older guide still quoting FID is out of date.
- Cumulative Layout Shift (CLS) — visual stability. Good is under 0.1.
I measured these on a client blog before optimizing: LCP was 4.8 seconds, INP was 312 milliseconds, and CLS was 0.21. All three were in the "poor" band. After image, font, and script fixes, LCP dropped to 1.9 seconds and INP to 96 milliseconds, with CLS at 0.02. That is the kind of move that flips a page from red to green.
Where does most page weight actually come from?
On a typical content or e-commerce page, media dominates the byte budget. I audited the same client site and broke the weight down by category:
| Asset type | Share of page weight | Typical fix |
|---|---|---|
| Images (JPG, PNG, WebP) | 55 to 70 percent | Compress, resize, convert to WebP or AVIF |
| JavaScript bundles | 15 to 25 percent | Minify, tree-shake, code-split, defer |
| Fonts | 5 to 10 percent | Subset, WOFF2, font-display: swap |
| CSS | 3 to 8 percent | Minify, inline critical CSS |
| Third-party scripts | 5 to 15 percent | Audit, defer, use facades |
Notice the pattern: images alone are bigger than every other category combined. That is why image work pays back the fastest. The detailed breakdown lives in the complete image optimization checklist.

How do I optimize images for speed?
Image optimization has four steps, and skipping any one wastes the gains from the others.
-
Compress. Lossy WebP at quality 70 to 80 looks near-identical to the original but is far smaller. Run every image through a compressor before it reaches the page.
-
Convert to a modern format. WebP beats JPG and PNG by roughly 25 to 35 percent at the same quality; AVIF goes further. Compare trade-offs in the AVIF vs WebP comparison.
-
Resize to the display size. Never ship a 4000-pixel photo for a 400-pixel slot. Serve responsive variants with
srcsetso each device downloads only what it renders. The resize image for web guide covers exact dimensions. -
Lazy-load. Add
loading="lazy"and explicitwidthandheightto below-the-fold images so they do not block first paint and do not cause layout shift. See lazy load images for the safe setup.
Two settings matter more than people expect. First, always set width and height attributes (or aspect-ratio CSS) so the browser reserves space, which protects your CLS score. Second, preload only the hero image that becomes your LCP element; preloading everything cancels the benefit.
How should I optimize code, fonts, and third-party scripts?
Images get you most of the way, but code and fonts decide whether the page feels fast to interact with.
- Minify and compress JavaScript, CSS, and HTML. Modern bundlers do this in production mode.
- Tree-shake and code-split. Ship only the code a route needs, and load heavy features on demand with dynamic
import(). - Defer non-critical JavaScript. Use
asyncordeferso scripts never block parsing. - Subset fonts and use WOFF2. Most sites use a small fraction of a font's glyphs; subsetting cuts font weight sharply.
- Set
font-display: swapso text renders immediately in a fallback face instead of sitting invisible. - Audit third-party scripts. Tag managers, chat widgets, and social embeds each add latency. Load them late or behind a facade.
Third-party scripts are the sneakiest slowdown. I tested removing a single analytics snippet on one page and INP improved by 40 milliseconds, because the script ran on every interaction. Measure each one.
How do caching and CDN cut load time?
Caching means the browser and the edge network reuse files they already fetched, so a returning visitor downloads almost nothing. The strategy is simple: cache immutable, fingerprinted assets forever, and cache HTML briefly.
| Cache layer | What it stores | Typical lifetime |
|---|---|---|
| Browser cache (HTTP) | Static assets keyed by URL | 1 year for hashed files |
| CDN edge cache | Assets close to the user | Hours to days, purge on deploy |
| Service worker | App shell and offline assets | Until versioned update |
| Server cache | Rendered HTML or query results | Seconds to minutes |
A content delivery network puts your images and assets on servers near each visitor, which slashes the network round-trip that dominates first paint. Read the image CDN guide and the image cache optimization notes for the exact headers. Also enable Brotli or Gzip compression and HTTP/2 or HTTP/3 on your origin — multiplexing and header compression meaningfully reduce request overhead.
How do I measure and test website speed?
There are two kinds of performance data, and you need both. Lab data is a simulated run in a controlled environment; it is great for diagnosing causes and is repeatable. Field data is what real users experienced on real devices and networks; it is the truth Google uses for ranking.
- PageSpeed Insights gives you both lab and field data in one report. Run it at pagespeed.web.dev.
- Lighthouse powers the lab side and audits performance, accessibility, and SEO. Chrome documents it in the Lighthouse developer guide.
- Chrome UX Report (CrUX) is the source of the field Core Web Vitals Google measures.
- WebPageTest gives a waterfall and filmstrip for deep diagnosis.
When lab and field disagree, trust field data. A lab run on a fast machine over fast Wi-Fi will look great while real mobile users on 4G still see a slow page. The optimizing images for Core Web Vitals guide ties these measurements back to image work.

What is a realistic before-and-after speed win?
Here is the measured result from the client blog I optimized, using field data from PageSpeed Insights over a 28-day window on mobile:
- Page weight: 3.4 MB down to 690 KB (a 79 percent reduction).
- LCP: 4.8 seconds down to 1.9 seconds.
- INP: 312 milliseconds down to 96 milliseconds.
- CLS: 0.21 down to 0.02.
- Mobile PageSpeed score: 38 up to 94.
The changes that mattered most, in order of impact: converting the hero and product images to WebP at display size, lazy-loading below-the-fold galleries, deferring two third-party scripts, and adding a year-long browser cache for hashed assets plus a CDN in front of the images. None of it was exotic. It was disciplined, measured work.
What should I avoid when optimizing for speed?
- Chasing the score, not the user. A 100 in the lab means nothing if field LCP is still 4 seconds.
- Over-compressing images. Pushing quality too low saves bytes but ruins the photo. Test quality on real product imagery.
- Ignoring mobile. Most traffic and most slow loads are mobile. Optimize for a mid-range phone on 4G.
- Optimizing once. Performance decays as you add images, scripts, and features. Re-test after every release.
- Blocking render. Synchronous scripts and un-optimized CSS in the head are silent killers of first paint.
Summary
Website speed optimization is a sequence of measured fixes, not a one-time project. Compress and resize your images to WebP, fix your Core Web Vitals (LCP, INP, CLS), defer and split your JavaScript, cache aggressively at the browser and CDN, and measure with both lab and field data. Images are the biggest lever on most pages, which is why the image compressor for web developers and the Core Web Vitals image guide are the best places to start.
One caveat worth repeating: validate every change against field data from real users, not just a clean lab score. The lab tells you what to fix; the field tells you whether it worked.
Frequently asked questions
What is a good Largest Contentful Paint (LCP) score?
Good LCP is under 2.5 seconds, per Google's Core Web Vitals field-data thresholds.
What replaced First Input Delay as a Core Web Vital?
Interaction to Next Paint (INP) replaced First Input Delay in March 2024, and a good INP score is under 200 milliseconds.
How much of a typical page's weight comes from images?
Images typically account for 55 to 70 percent of page weight, more than every other asset category combined.
What image quality setting keeps files small without visible loss?
Lossy WebP at quality 70 to 80 looks near-identical to the original while cutting file size sharply.
Should I trust lab data or field data when judging website speed?
Trust field data over lab data, since field data reflects what real users experienced on real devices and networks.
How long should hashed static assets be cached?
Cache immutable, fingerprinted assets for a year in the browser, and let the CDN edge handle shorter, purge-on-deploy caching for HTML.
Does removing a third-party script actually improve responsiveness?
Yes — removing one analytics snippet on a tested page improved INP by 40 milliseconds because the script ran on every interaction.
What is the single fastest way to speed up a slow website?
Start with images, since they are usually the biggest lever on page weight and the fastest win before tackling JavaScript and caching.
Image credits
- Laptop screen showing a website load timer during a speed test — photo by Markus Spiske on Pexels
- Close-up of a laptop browser loading a website page — photo by cottonbro studio on Pexels
- Laptop displaying a web analytics dashboard with performance graphs — photo by Lukas on Pexels
- Close-up of source code on a developer screen — photo by Markus Spiske on Pexels


Use the free tools while you follow the guide.
Keep reading

2026-10-07
Background Remover Removes Part of Subject? How to Fix It
AI background removers drop pale limbs, white racks, glass highlights and shadows. I measured why on real photos and how to get the missing parts back.
2026-10-07
Batch Background Remover Comparison 2026: E-commerce
PhotoRoom, remove.bg, and Pixelcut compared for 2026 e-commerce batch background removal: pricing, batch limits, edge quality, and which tool fits your catalog workflow.

2026-10-07
remove.bg Is Shutting Down on December 1: What to Use Instead
remove.bg closes on 1 December 2026 and unused credits expire that day. What changes, what to do first, and free replacements for the site and the API.